gLiveView
Reminder !!
Ensure the Pre-Requisites are in place before you proceed.
Koios gLiveView is a local monitoring tool to use in addition to remote monitoring tools like Prometheus/Grafana, Zabbix or IOG's RTView. This is especially useful when moving to a systemd deployment - if you haven't done so already - as it offers an intuitive UI to monitor the node status.
Configuration & Startup⚓︎
For most setups, it's enough to set CNODE_PORT in the env file. The rest of the variables should automatically be detected. If required, modify User Variables in env and gLiveView.sh to suit your environment (if the environment is customised). This should lead you to a stage where you can now start running ./gLiveView.sh in the folder you downloaded the script (the default location would be $CNODE_HOME/scripts). Note that the script is smart enough to automatically detect when you're running as a Core or Relay and will show fields accordingly.
The tool can be run in legacy mode with only standard ASCII characters for terminals with trouble displaying the box-drawing characters. Run ./gLiveView.sh -h to show available command-line parameters or permanently set it directly in script.
Note !!
Keeping gLiveView to it's intent of being a dashboard and not a full-fledged monitoring tool, we intend to keep most relevant information for a node operator in a minimalistic dashboard, accordingly - gLiveView runs by default in compact mode. One can enable verbose mode by pressing 'v' to unhide additional fields.
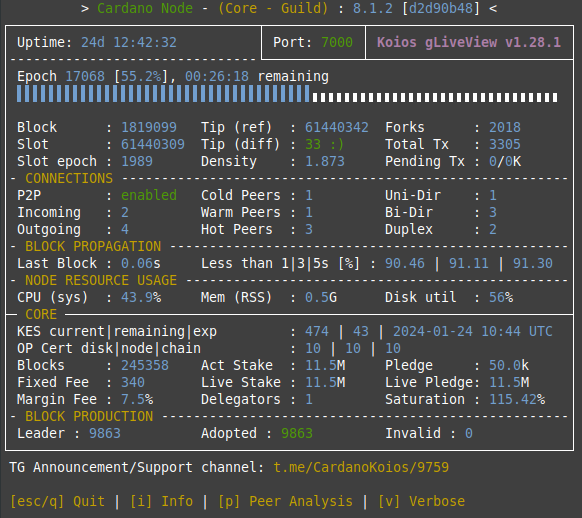
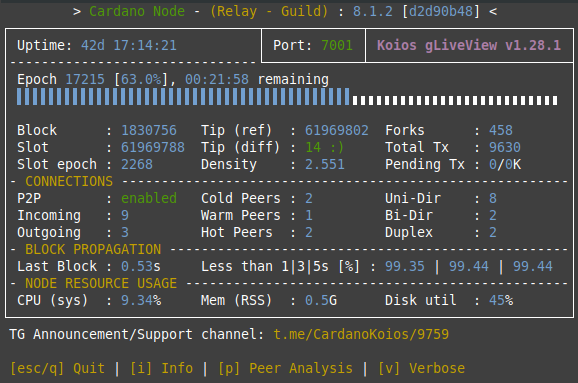
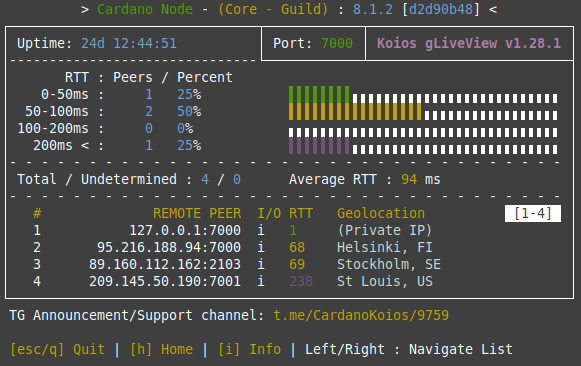
A sample output from both core and relay together with peer analysis:


Upper main section⚓︎
Displays live metrics from cardano-node gathered through the nodes Prometheus endpoint.
- Epoch Progress - Epoch number and progress is live from the node while date calculation until epoch boundary is based on offline genesis parameters.
- Block - The nodes current block height since genesis start.
- Slot - The nodes current slot height since current epoch start.
- Density - With the current chain parameters(MainNet), a block is created roughly every 20 seconds(
activeSlotsCoeff). A slot on MainNet happens every 1 second(slotLength), thus the max chain density can be calculated asslotLength/activeSlotsCoeff = 5%. Normally, the value should fluctuate around this value. - Total Tx - The total number of transactions processed since node start.
- Pending Tx - The number of transactions and the bytes(total, in kb) currently in mempool to be included in upcoming blocks.
- Tip (ref) - Reference tip is an offline calculation based on genesis values for current slot height since genesis start.
- Tip (diff) / Status - Will either show node status as
starting|sync xx.x%or if close to reference tip, the tip differenceTip (ref) - Tip (node)to see how far of the tip (diff value) the node is. With current parameters a slot diff up to 40 from reference tip is considered good but it should usually stay below 30. It's perfectly normal to see big differences in slots between blocks. It's the built in randomness at play. To see if a node is really healthy and staying on tip you would need to compare the tip between multiple nodes. - Forks - The number of forks since node start. Each fork means the blockchain evolved in a different direction, thereby discarding blocks. A high number of forks means there is a higher chance of orphaned blocks.
- Peers In / Out - Shows how many connections the node has established in and out. See Peer analysis section for how to get more details of incoming and outgoing connections.
- P2P Mode
Coldpeers indicate the number of inactive but known peers to the node.Warmpeers tell how many established connections the node has.Hotpeers how many established connections are actually active.Bi-Dir(bidirectional) andUni-Dir(unidirectional) indicate how the handshake protocol negotiated the connection. The connection between p2p nodes will always be bidirectional, but it will be unidirectional between p2p nodes and non-p2p nodes.Duplexshows the connections that are actually used in both directions, only bidirectional connections have this potential.- Mem (RSS) - RSS is the Resident Set Size and shows how much memory is allocated to cardano-node and that is in RAM. It does not include memory that is swapped out. It does include memory from shared libraries as long as the pages from those libraries are actually in memory. It does include all stack and heap memory.
- Mem (Live) / (Heap) - GC (Garbage Collector) values that show how much memory is used for live/heap data. A large difference between them (or the heap approaching the physical memory limit) means the node is struggling with the garbage collector and/or may begin swapping.
- GC Minor / Major - Collecting garbage from "Young space" is called a Minor GC. Major (Full) GC is done more rarily and is a more expensive operation. Explaining garbage collection is a topic outside the scope of this documentation and google is your friend for this.
- Block propagation - Last Block measures the duration between when the last block was scheduled to be produced and when the node learned about it. Late blocks are blocks whose delay is larger than 5s. If the node is not synching, the number of late blocks needs to stay low. Within ⅓/5s estimates the chance of observing a delay of ⅓/5s (based on the delays observed for previous blocks). A healthy node needs to stay above 95% of blocks within 3s. Finally, served blocks counts how many blocks were fetched by "in" peers. If this does not increase for a long time, it means the "in" peers are learning about new blocks from somewhere else (and therefore this node is not contributing towards accelerating the propagation). Overall, these metrics are helpful in tweaking the topology and/or performance of the network links.
Core section⚓︎
If the node is run as a core, identified by the 'forge-about-to-lead' parameter, a second core section is displayed.
- KES period / expiration - This section contain the current and remaining KES periods as well as a calculated date for the expiration. When getting close to expire date the values will change color.
-
Missed slot checks - A value that show if the node have missed slots for attempting leadership checks (as absolute value and percentage since node startup).
!!! info "Missed Slot Leadership Check"Note that while this counter should ideally be close to zero, you would often see a higher value if the node is busy (e.g. paused for garbage collection or busy with reward calculations). A consistently high percentage of missed slots would need further investigation (assistance for troubleshooting can be seeked here ), as in extremely remote cases - it can overlap with a slot that your node could be a leader for.
-
Blocks - If CNCLI is activated to store blocks created in a blocklog DB, data from this blocklog is displayed. See linked CNCLI documentation for details regarding the different block metrics. If CNCLI is not deployed, block metrics displayed are taken from node metrics and show blocks created by the node since node start.
Peer analysis⚓︎
A manual peer analysis can be triggered by key press p. A latency test will be done on incoming and outgoing connections to the node.
Note
Note that with P2P enabled, an incoming/outgoing connection can be reused for bi-directional traffic. There isnt a way to distinctly identify the P2P peer's direction yet for a given IP.
Outgoing connections(peers in topology file), ping type used is done in this order:
1. cncli - If available, this gives the most accurate measure as it checks the entire handshake process against the remote peer.
2. ss - Sends a TCP SYN package to ping the remote peer on the cardano-node port. Should give ~100% success rate.
2. tcptraceroute - Same as ss.
3. ping - fallback method using ICMP ping against IP. Will only work if firewall of remote peer accept ICMP traffic.
For incoming connections, only ICMP ping is used as remote peer port is unknown. It's not uncommon to see many undetermined peers for incoming connections as it's a good security practice to disable ICMP in firewall.
Once the analysis is finished, it will display the RTTs (return-trip times) for the peers and group them in ranges 0-50, 50-100, 100-200, 200<. The analysis is NOT live. Press [h] Home to go back to default view or [i] Info to show in-script help text. Up and Down arrow keys is used to select incoming or outgoing detailed list of IPs and their RTT value. Left (<) and Right (>) arrow keys can be used to navigate the pages in the selected list.
Troubleshooting/Customisations⚓︎
In case you run into trouble while running the script, you might want to edit env & gLiveView.sh and look at User Variables section. You can override the values if the automatic detection do not provide the right information, but we would appreciate if you could also notify us by raising an issue against the GitHub repository:
gLiveView.sh
######################################
# User Variables - Change as desired #
######################################

NODE_NAME="Cardano Node"                  # Change your node's name prefix here, keep at or below 19 characters!
REFRESH_RATE=2                            # How often (in seconds) to refresh the view (additional time for processing and output may slow it down)
LEGACY_MODE=false                         # (true|false) If enabled unicode box-drawing characters will be replaced by standard ASCII characters
RETRIES=3                                 # How many attempts to connect to running Cardano node before erroring out and quitting
PEER_LIST_CNT=6                           # Number of peers to show on each in/out page in peer analysis view
THEME="dark"                              # dark  = suited for terminals with a dark background
                                          # light = suited for terminals with a bright background
ENABLE_IP_GEOLOCATION="Y"                 # Enable IP geolocation on outgoing and incoming connections using ip-api.com